
When vCenter raises a Host error alarm with the message hostd detected to be non-responsive on ESXi 7.x or 8.x, the instinct is to assume hostd has hung. In most intermittent cases where the alarm self-clears within seconds to minutes, that assumption is incorrect.
What This Alert Actually Means
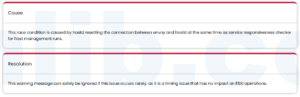
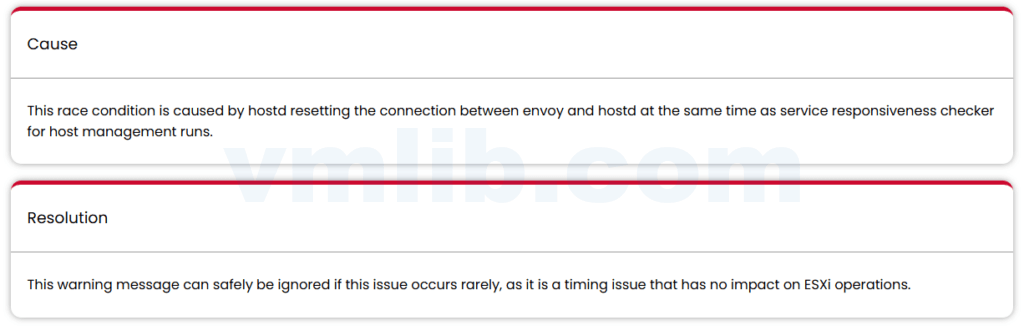
The alert fires when a timing race condition overlaps two internal operations: hostd resetting the connection between itself and the envoy proxy, and the host management service responsiveness checker running its periodic probe. When these two events collide, vCenter sees a momentary failure to reach hostd and raises the alarm. Once the connection reset completes and the next probe succeeds, the alarm clears on its own.
When the alarm is brief, self-clears, and matches the log signature below, it may be the known timing condition rather than a sustained hostd failure.
Triage: hostd-Only or Something Bigger
Before dismissing the alert, confirm the scope. The key distinction is whether only hostd is intermittently unreachable or whether the host itself is experiencing broader issues.
hostd-only symptoms (likely the race condition)
- vSphere Client shows a Host error alarm
- Event log displays hostd detected to be non-responsive or Host connection and power state alarm
- The alarm self-clears without intervention
- hostd.log contains HTTP Connection timed out errors
- envoy-access.log shows envoy returning 503 status codes
Full-host, network, or storage symptoms (investigate separately)
- Host remains disconnected or not responding after several minutes
- Multiple hosts affected simultaneously
- Storage paths degraded or all-paths-down events
- Network connectivity loss to the management interface
- High CPU or memory pressure on the host
- VMs reporting I/O timeouts or guest OS freezes
If you see any of the full-host symptoms, the race condition described here is not your problem. Focus on storage, network, or resource contention instead.
Evidence Collection
When the alert fires, gather the following before it self-clears or before taking any action.
Check whether hostd is running:
ps | grep hostdCheck hostd resource usage:
top | grep hostdVerify host boot state and process listing:
esxcli system boot get
esxcli system process list | grep hostd
Test local connectivity:
esxcli network diag ping --host 127.0.0.1Log Correlation
The diagnosis depends on correlating timestamps across three sources.
vCenter events
Note the exact time the hostd detected to be non-responsive alarm triggered and when it cleared. This window is your reference frame for everything else.
hostd.log
Look for the HTTP connection timeout entry within the alarm window:
YYYY-MM-DDTXX:XX:XX.XXXZ In(166) Hostd[2101821]: [Originator@6876 sub=SoapAdapter.HTTPService.HttpConnection] HTTP Connection has timed out while waiting for further requests; <io_obj p:0x000000f8a476a780, h:-1, , <TCP '127.0.0.1 : ** '>>, N7Vmacore16TimeoutExceptionE(Operation timed out: Stream: <io_obj p:0x000000f8a476a780, h:-1, , <TCP '127.0.0.1 : '>>, duration: 00:00:48.154064 (hh:mm:ss.us))The timeout duration in the log entry — approximately 48 seconds in this example — shows how long hostd waited before closing the idle connection. This is the connection reset that overlaps with the responsiveness checker.
envoy-access.log
Look for the 503 response within the same window:
YYYY-MM-DDTXX:XX:XX.XXXZ In(166) envoy-access[2101209]: GET /sdk/service 503 upstream_reset_before_response_started{connection_termination} UC 0 95 - 0 - - 127.0.0.1: HTTP/1.1 - 127.0.0.1:80 127.0.0.1: HTTP/1.1 - 127.0.0.1:8307 - -The upstream_reset_before_response_started{connection_termination} flag confirms envoy detected the connection reset from hostd. This is the signature of the race condition.
If all three sources align within the same time window and the alarm self-cleared, the evidence is consistent with the timing condition described in the source case. Record the occurrence and continue monitoring rather than restarting services immediately.
When Not to Restart Agents
Because hostd is not actually hung in this scenario, restarting management agents is unnecessary and counterproductive.
- Do not reboot the host. The problem self-resolves. A reboot only adds unplanned downtime.
- Do not restart hostd or the management agents unless the host remains disconnected after the alarm fails to self-clear. If the host stays disconnected for an extended period, you are likely dealing with a different problem and should investigate accordingly.
- VMs are not affected. Virtual machine execution is handled directly by VMkernel and does not depend on hostd’s responsiveness to vCenter. No VM-level action is required.
When Frequency Increases
If the alert transitions from occasional to frequent — multiple times per day on the same host — treat it as a signal to investigate host health rather than continuing to dismiss it:
- Check CPU, memory, and storage resource utilization on the host
- Monitor hostd process performance over time using
top - Review hostd.log and envoy-access.log for other error patterns beyond the timeout and 503 entries
- Look for concurrent operations that might stress hostd, such as heavy vMotion activity, large reconfiguration tasks, or storage path failovers
Frequent occurrences do not necessarily mean the race condition has worsened. They may indicate that hostd is under enough load that the responsiveness checker is more likely to catch it during a connection reset window.
Escalation Evidence
If you need to open a support request, gather the following before calling:
| Item | Source |
|---|---|
| Alarm trigger and clear timestamps | vCenter events |
| hostd.log covering 30 minutes before and after the alarm | hostd.log |
| envoy-access.log covering the same window | envoy-access.log |
Output of ps, top, and esxcli system process list during the event |
Live capture if possible |
| Frequency log — how often the alarm fires per day | vCenter alarm history |
The log entries showing the HTTP timeout in hostd.log paired with the 503 in envoy-access.log are the core evidence VMware support will look for. Having them ready with timestamps correlated to the vCenter alarm saves time on the call.
Operational takeaway
The hostd detected to be non-responsive alarm on ESXi 7.x/8.x is, in its intermittent and self-clearing form, a timing race condition between hostd’s envoy connection reset and the responsiveness checker. It does not indicate a true hostd hang, does not affect VM operations, and does not require a host reboot or agent restart. Confirm the log signatures, verify the alarm self-clears, and move on — unless frequency increases, at which point host resource health becomes the real question.
Source article: ESXi 7.x/8.x hostd 间歇性无响应事件分析. This English version was reviewed against the source logs and edited to remove unsupported upgrade assumptions.



 VM技术助理